
Summary of key points
Increased debt recovery rates from 65% to 78% within six months, adding $2 million in recovered revenue.
Cut time to send payment requests by 53%, reducing from 15 minutes to 7 minutes per request.
Boosted Net Promoter Score (NPS) from 15 to 50, indicating higher user satisfaction.
Improved installment plan usage by 50%, leading to steadier cash flows.
Decreased manual tasks by 60% through automation features.
Achieved 95% user adoption rate within the first quarter post-launch.
Reduced manual data processing time by 55%, saving up to 6 hours per week per analyst.
Designing a Debt Repayment and Collections Dashboard for Berkeley Payment Solutions
Introduction
At Berkeley Payment Solutions, a leading fintech firm in Toronto, I led the design of a Debt Repayment and Collections dashboard tailored for our enterprise clients. The goal was to create an intuitive, data-driven platform that streamlines debt management, enhances recovery rates, and provides actionable insights to stakeholders.
Challenges We Faced
We identified several critical issues that needed addressing:
Complex Payment Requests: Clients struggled with inefficient processes when sending payment requests.
Installment Management Difficulties: Setting up and tracking installment plans was cumbersome.
Inefficient Collections Tracking: Collection and installment histories were scattered, leading to operational inefficiencies.
Data Overload: Users were overwhelmed by unstructured data, causing analysis paralysis.
Inefficient Workflows: Analysts spent up to 6 hours per week on manual data processing.
Stagnant Recovery Rates: Debt recovery hovered at an average of 65%, with no effective tools to improve it.
The Solution I Developed
Focusing on user-centric design, I aimed to enhance key user flows:
Streamlined Payment Requests: Simplified the process to reduce time by 40%.
Easy Installment Creation: Enabled users to set up installment plans effortlessly.
Unified Histories: Consolidated collection and installment histories into a single, accessible dashboard.
Data Visualization: Introduced intuitive visual tools to help users make sense of data quickly.
Automation Features: Implemented automation to cut down manual data processing by 55%.
Enhanced Recovery Tools: Designed features aimed at boosting debt recovery rates by 20% within the first year.
Improved User Satisfaction: Set a goal to raise the Net Promoter Score (NPS) from 15 to 40+.
Research and Insights
I conducted extensive user research, including interviews with 35 professionals like debt analysts, recovery agents, and financial managers. Key findings included:
72% found sending payment requests cumbersome.
80% lacked an efficient way to manage installment plans.
85% wanted a unified view of collections and installments.
Analysts spent an average of 5.5 hours per week on manual data compilation.
Design Process
I followed a structured design process:
Empathy Mapping and Personas: Developed personas to deeply understand user needs.
User Journey Mapping: Mapped current and ideal user journeys, reducing steps in key processes by up to 50%.
Wireframing and Prototyping: Created interactive prototypes to simulate new features.
Usability Testing: Conducted tests with 20 users, tracking metrics like task completion rates and time on task.

Key Features Designed
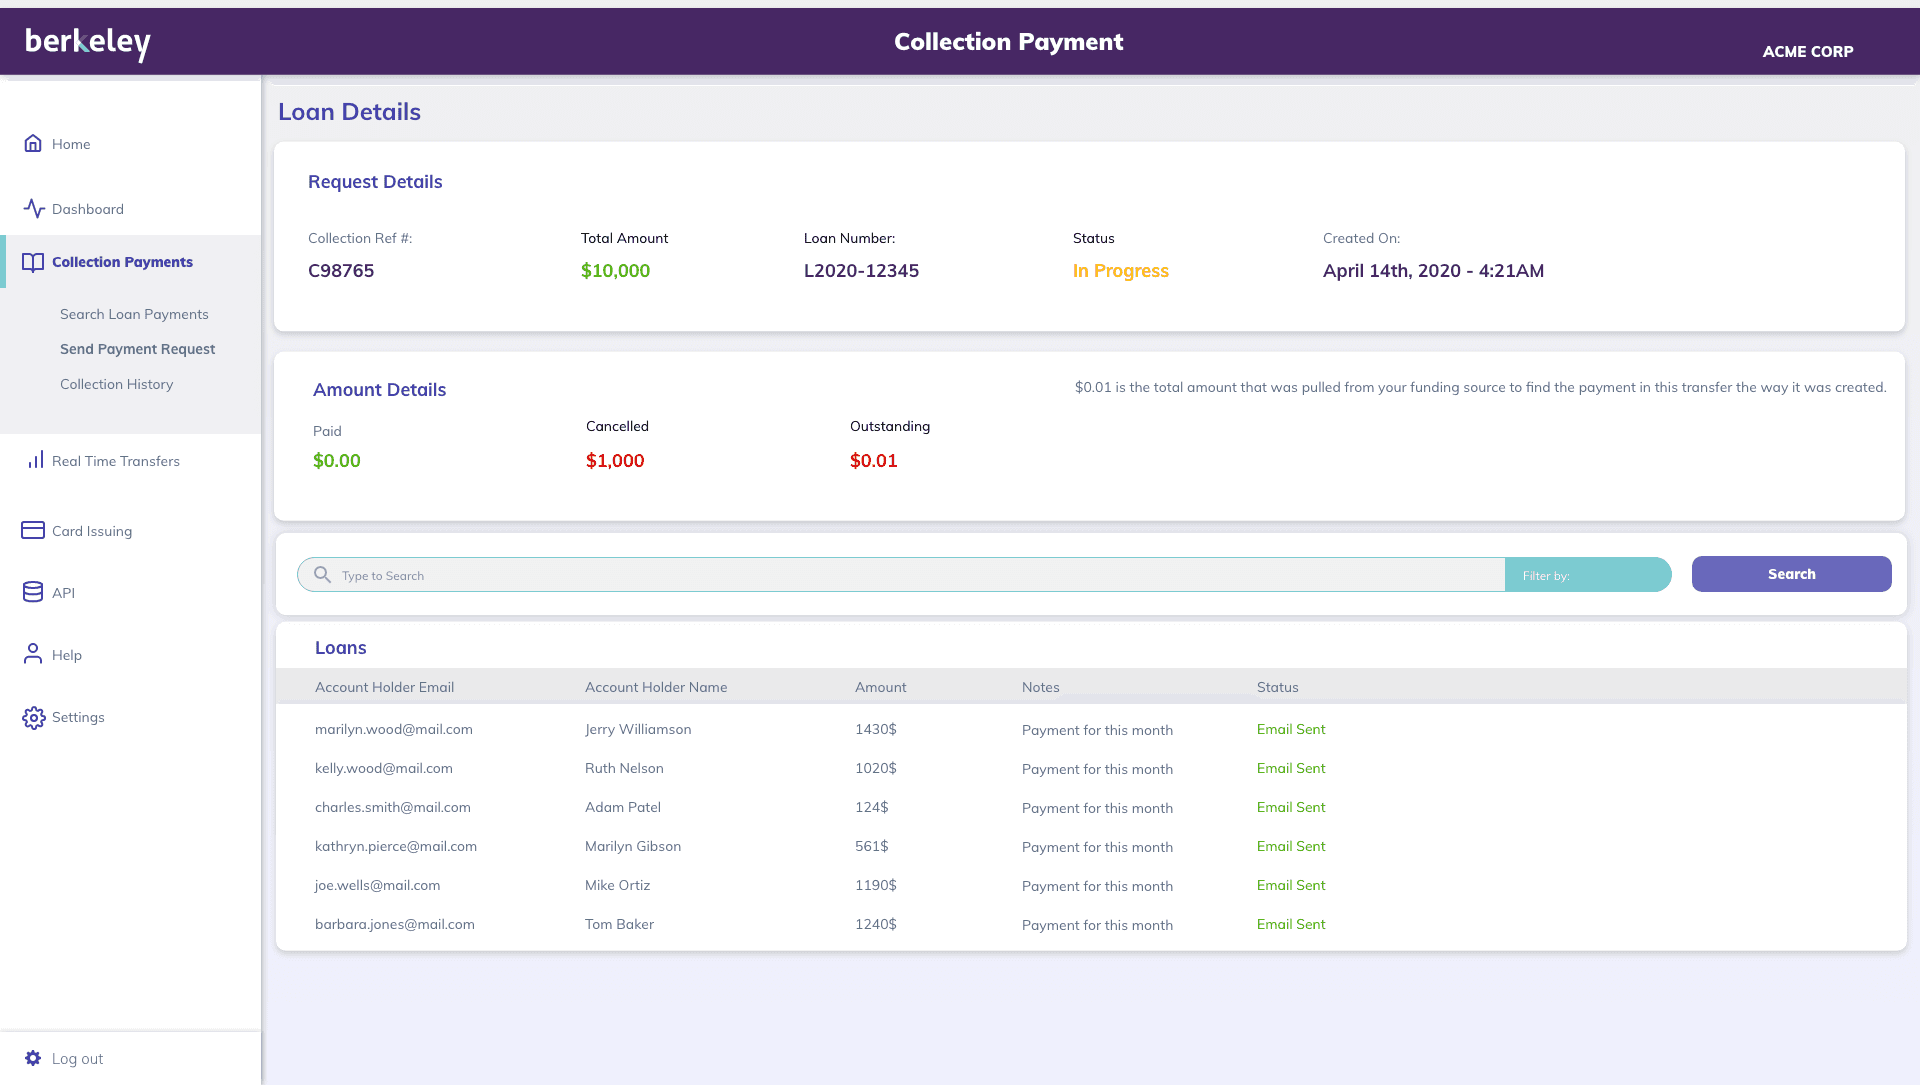
Simplified Payment Requests: Reduced the time to send a payment request from 15 minutes to 7 minutes.
Intuitive Installment Interface: Increased usage of installment plans by 50%.
Unified Dashboard: Enhanced data accessibility, leading to 30% faster decision-making.
Advanced Data Visualization: Implemented interactive charts and heatmaps.
Automated Reporting: Saved approximately 2 hours per week per user.

Results That Helped the Company and Its Clients
The impact was significant:
Efficiency Gains:
Reduced manual data processing time by 55%.
Decreased manual tasks by 60% through automation.
Financial Impact:
Increased recovery rates from 65% to 78% in six months.
Contributed an additional $2 million in recovered revenue.
Improved installment plan adoption led to steadier cash flows.
User Satisfaction:
NPS jumped from 15 to 50.
Achieved a 95% user adoption rate within the first quarter.
Received positive feedback from clients, enhancing our reputation.
Impact on the Company's Bottom Line
By enhancing the dashboard, we not only improved operational efficiency but also significantly increased revenue through higher recovery rates. The additional $2 million recovered directly contributed to the company's profitability. Improved client satisfaction and user adoption rates also positioned us favorably in the competitive fintech market.
Takeaways That Made Me a Better Designer
This project taught me valuable lessons:
User-Centric Design is Crucial: Tailoring solutions to user needs leads to higher adoption and satisfaction.
Streamlining Processes Pays Off: Simplifying complex tasks can have a substantial impact on efficiency.
Collaboration is Key: Working closely with developers and stakeholders ensures alignment and smooth implementation.
Continuous Feedback is Essential: Regular testing and iteration help catch issues early and refine the product effectively.
Data-Driven Decisions Lead to Success: Leveraging analytics informed better design choices and measurable outcomes.
Conclusion
Leading the design of the Debt Repayment and Collections dashboard was both challenging and rewarding. By focusing on critical user flows and data-driven insights, we delivered a platform that significantly improved efficiency, increased recovery rates, and elevated user satisfaction for our enterprise clients. This project not only enhanced our clients' operations but also contributed positively to Berkeley Payment Solutions' bottom line.

